UNITED STATES
SECURITIES AND EXCHANGE COMMISSION
Washington, D.C. 20549
FORM 8-K
CURRENT REPORT
Pursuant to Section 13 or 15(d) of the Securities Exchange Act of 1934
Date of Report (Date of Earliest Event Reported): March 1, 2017
PDL BioPharma, Inc.
(Exact name of Company as specified in its charter)
000-19756
(Commission File Number)
Delaware | 94-3023969 | |
(State or Other Jurisdiction of Incorporation) | (I.R.S. Employer Identification No.) | |
932 Southwood Boulevard
Incline Village, Nevada 89451
(Address of principal executive offices, with zip code)
(775) 832-8500
(Company’s telephone number, including area code)
Check the appropriate box below if the Form 8-K filing is intended to simultaneously satisfy the filing obligation of the Company under any of the following provisions:
¨ Written communications pursuant to Rule 425 under the Securities Act (17 CFR 230.425)
¨ Soliciting material pursuant to Rule 14a-12 under the Exchange Act (17 CFR 240.14a-12)
¨ Pre-commencement communications pursuant to Rule 14d-2(b) under the Exchange Act (17 CFR 240.14d-2(b))
¨ Pre-commencement communications pursuant to Rule 13e-4(c) under the Exchange Act (17 CFR 240.13e-4(c))
Item 2.02 Results of Operations and Financial Condition.
On March 1, 2017, PDL BioPharma, Inc. (the Company) issued a press release announcing its financial results for the fourth quarter ended December 31, 2016. A copy of this earnings release is furnished hereto as Exhibit 99.1. The Company will host an earnings call and webcast on March 1, 2017, during which the Company will discuss its financial results for the fourth quarter ended December 31, 2016.
Item 7.01 Regulation FD Disclosure.
Presentation Materials
On March 1, 2017, the Company posted to its website a set of presentation materials that it will use during its earnings call and webcast to assist participants with understanding the Company’s financial results for the quarter ended December 31, 2016. A copy of this presentation is attached hereto as Exhibit 99.2.
Information Sheet
On March 1, 2017, the Company distributed to analysts covering the Company’s securities a summary of certain information regarding the Company’s net income, dividends, recent transactions and licensed product development and sales (the Information Sheet) to assist those analysts in valuing the Company’s securities. The Information Sheet and its associated tables are attached hereto as Exhibit 99.3.
Limitation of Incorporation by Reference
In accordance with General Instruction B.2. of Form 8-K, the information in this report, including the exhibits, is furnished pursuant to Items 2.02 and 7.01 and shall not be deemed to be “filed” for the purpose of Section 18 of the Securities Exchange Act of 1934, as amended, or otherwise subject to the liabilities of that section and shall not be deemed to be incorporated by reference into any filing of the Company under the Securities Act of 1933, as amended or the Exchange Act.
Cautionary Statements
This filing and its exhibits include “forward-looking statements” within the meaning of Section 27A of the Securities Act of 1933, as amended, and Section 21E of the Securities Exchange Act of 1934, as amended. Although we believe that the expectations reflected in the forward-looking statements are reasonable, we can give no assurance that such expectations will prove to be correct. Important factors that could impair the Company’s royalty assets or business are disclosed in the “Risk Factors” contained in the Company’s Annual Report on Form 10-K, filed with the Securities and Exchange Commission on March 1, 2017, as updated by subsequent periodic filings. All forward-looking statements are expressly qualified in their entirety by such factors. We do not undertake any duty to update any forward-looking statement except as required by law.
Item 9.01 Financial Statements and Exhibits.
The following exhibits are furnished with this report:
Exhibit No. | Description | |
99.1 | Press Release | |
99.2 | Presentation | |
99.3 | Information Sheet | |
SIGNATURES
Pursuant to the requirements of the Securities Exchange Act of 1934, the Company has duly caused this report to be signed on its behalf by the undersigned hereunto duly authorized.
PDL BIOPHARMA, INC. | ||
(Company) | ||
By: | /s/ Peter S. Garcia | |
Peter S. Garcia | ||
Vice President and Chief Financial Officer | ||
Dated: March 1, 2017
Exhibit Index
Exhibit No. | Description | |
99.1 | Press Release | |
99.2 | Presentation | |
99.3 | Information Sheet | |
Exhibit 99.1
Contacts: | ||
Peter Garcia | Jennifer Williams | |
PDL BioPharma, Inc. | Cook Williams Communications, Inc. | |
775-832-8500 | 360-668-3701 | |
Peter.Garcia@pdl.com | jennifer@cwcomm.org | |
PDL BioPharma Announces Fourth Quarter and Year End 2016 Financial Results
INCLINE VILLAGE, NV, March 1, 2017 – PDL BioPharma, Inc. (PDL or the Company) (NASDAQ: PDLI) today reported financial results for the fourth quarter and year ended December 31, 2016 including:
• | Total revenues of $66.5 million and $244.3 million for the three and twelve months ended December 31, 2016, respectively. |
• | GAAP diluted EPS of ($0.06) and $0.39 for the three and twelve months ended December 31, 2016, respectively. |
• | GAAP net loss attributable to PDL’s shareholders of $10.3 million and net income of $63.6 million for the three and twelve months ended December 31, 2016, respectively. |
• | Non-GAAP net loss attributable to PDL’s shareholders of $8.6 million and net income of $108.1 million for the three and twelve months ended December 31, 2016, respectively. A full reconciliation of all components of the GAAP to non-GAAP financial results can be found in Table 4 at the end of the release. |
The loss attributable to the three months ended December 31, 2016 was a result of a $51.1 million impairment charge relating to our Direct Flow Medical note receivable investment.
“2016 was a transformational year for PDL; one in which we took advantage of opportunities in the specialty pharma space as another tool to increase shareholder value,” said John P. McLaughlin, president and chief executive officer of PDL. “As we look to 2017, we will focus our efforts on Noden product commercialization, along with acquiring additional specialty pharma assets, to drive value creation for PDL and our shareholders.”
Recent Developments
• | PDL announced today that the company’s board of directors has authorized the repurchase of up to $30 million of the company’s common stock through March 2018. |
• | As a result of ARIAD Pharmaceuticals, Inc. being acquired by Takeda Pharmaceuticals Company Limited on February 16, 2017, PDL exercised its put option with ARIAD and will be repaid an estimated $110 million, which is 1.2 times the original investment less any sums paid to date. We received $9.3 million of royalty payments through December 31, 2016. The cash repayment is expected in late March or early April of 2017. |
• | PDL received a royalty payment for the first quarter of 2017 in the amount of $14.2 million for royalties earned on sales of Tysabri. The duration of this royalty payment is based on the sales of product manufactured prior to patent expiry, the amount of which is uncertain. |
• | In January 2017 PDL monetized $7.0 million of certain assets of Direct Flow Medical acquired through its foreclosure. |
Revenue Highlights
• | Total revenues of $66.5 million for the three months ended December 31, 2016 included: |
◦ | Royalties from PDL’s licensees to the Queen et al. patents of $15.5 million, which consisted of royalties earned on sales of Tysabri® under a license agreement; |
◦ | Net royalty payments from acquired royalty rights and a change in fair value of the royalty rights assets of $28.1 million, which consisted of the change in estimated fair value of our royalty right assets, primarily related to the Depomed, Inc., University of Michigan, ARIAD and AcelRx Pharmaceuticals, Inc.; |
◦ | Interest revenue from notes receivable financings to kaléo and CareView Communications of $5.5 million; and |
◦ | Product revenues of $17.5 million from sales of Tekturna® and Tekturna HCT® in the United States and Rasilez® and Rasilez HCT® in the rest of the world (collectively, the Noden Products). |
• | Total revenues decreased by 63 percent for the three months ended December 31, 2016, when compared to the same period in 2015. |
◦ | The decrease in royalties from PDL’s licensees to the Queen et al. patents is due to the expiration of the patent license agreement with Genentech, Inc. |
◦ | The decrease in royalty rights - change in fair value was primarily due to the $27.8 million decrease in fair value of the University of Michigan Cerdelga® royalty right asset and the decrease in fair value of the AcelRx Zalviso® royalty rights asset, partially offset by an increase in the fair value of the ARIAD Pharmaceuticals, Inc. royalty right asset. |
◦ | PDL received $25.3 million in net cash royalty and milestone payments from its royalty rights in the fourth quarter of 2016, compared to $34.4 million for the same period of 2015. |
◦ | The decrease in interest revenues was primarily due to the early repayment of the Paradigm Spine, LLC notes receivable investment. |
◦ | Product revenues were derived from sales of the Noden Products. |
• | Total revenues decreased by 59 percent for the twelve months ended December 31, 2016, when compared to the same period in 2015. |
◦ | The decrease in royalties from PDL’s licensees to the Queen et al. patents is due to the expiration of the patent license agreement with Genentech, Inc. |
◦ | The decrease in royalty rights - change in fair value was primarily driven by a $36.6 million decrease in the fair value of the University of Michigan royalty rights Cerdelga asset, a $23.1 million decrease in the fair value of the Depomed royalty rights asset and a $3.0 million decrease in the fair value of the Viscogliosi Brothers, LLC royalty right asset, partially offset by a $14.8 million increase in the fair value of the ARIAD Pharmaceuticals, Inc. royalty right asset. |
◦ | PDL received $72.6 million in net cash royalty payments and milestone payments from its acquired royalty rights in the twelve months ended December 31, 2016, compared to $43.4 million for the same period of 2015. |
◦ | Product revenues and interest revenue variances were the same as the three months ended December 31, 2016. |
Operating Expense Highlights
• | Operating expenses were $74.2 million for the three months ended December 31, 2016, compared to $16.5 million for the same period of 2015. The increase in operating expenses for the three months ended December 31, 2016, as compared to the same period in 2015, was primarily a result of a $51.1 million impairment charge relating to our Direct Flow Medical note receivable investment and $11.4 million in expenses related to the Noden operations. |
• | Operating expenses were $114.9 million for the twelve months ended December 31, 2016, compared to $40.1 million for the same period of 2015. The increase in operating expenses for the twelve months ended December 31, 2016, as compared to the same period in 2015, was the result of the Direct Flow Medical impairment and $25.6 million in expenses related to the acquisition of the Noden Products and its operations. |
Other Financial Highlights
• | PDL had cash, cash equivalents, and investments of $242.1 million at December 31, 2016, compared to $220.4 million at December 31, 2015. |
• | Net cash provided by operating activities in the twelve months ended December 31, 2016 was $101.7 million, compared with $301.5 million in the same period in 2015. |
Conference Call and Webcast Details
PDL will hold a conference call to discuss financial results at 4:30 p.m. Eastern Time today, March 1, 2017.
To access the live conference call via phone, please dial (800) 668-4132 from the United States and Canada or (224) 357-2196 internationally. The conference ID is 77416821. Please dial in approximately 10 minutes prior to the start of the call. A telephone replay will be available beginning approximately one hour after the call through March 8, 2017, and may be accessed by dialing (855) 859-2056 from the United States and Canada or (404) 537-3406 internationally. The replay passcode is 77416821.
To access the live and subsequently archived webcast of the conference call, go to the Company’s website at http://www.pdl.com and go to “Events & Presentations.” Please connect to the website at least 15 minutes prior to the call to allow for any software download that may be necessary.
About PDL BioPharma, Inc.
PDL BioPharma, Inc. and its subsidiaries (collectively, the “Company”) seek to provide a significant return for its shareholders by acquiring and managing a portfolio of companies, products, royalty agreements and debt facilities in the biotech, pharmaceutical and medical device industries. In 2012, the Company began providing alternative sources of capital through royalty monetizations and debt facilities, and in 2016, the Company began acquiring commercial-stage products and launching specialized companies dedicated to the commercialization of these products. To date, the Company has consummated 16 of such transactions. Of these transactions, five have concluded with an average annual internal rate of return of 18.4%: Merus Labs International, Inc., Durata Therapeutics, Inc., AxoGen, Inc., Avinger, Inc. and Paradigm Spine, LLC. The Company has four debt transactions outstanding, representing deployed and committed capital of $269.0 million and $309.0 million, respectively: CareView Communications, Inc., kaléo, Inc., Direct Flow Medical, Inc., and LENSAR, Inc.; it has one hybrid royalty/debt transaction outstanding, representing deployed and committed capital of $44.0 million: Wellstat Diagnostics, LLC; and it has six royalty transactions outstanding representing deployed and committed capital of $496.1 million and $537.1 million, respectively: KYBELLA®, AcelRx Pharmaceuticals, Inc., ARIAD Pharmaceuticals, Inc., The Regents of the University of Michigan, Viscogliosi Brothers, LLC and Depomed, Inc. The Company’s equity and loan investments in Noden Pharma DAC and Noden Pharma USA, Inc. (together, “Noden”) represent deployed and committed capital of $110.0 million and $202.0 million, respectively.
The Company was formerly known as Protein Design Labs, Inc. and changed its name to PDL BioPharma, Inc. in 2006. PDL was founded in 1986 and is headquartered in Incline Village, Nevada. PDL pioneered the humanization of monoclonal antibodies and, by doing so, enabled the discovery of a new generation of targeted treatments for cancer and immunologic diseases for which it has received significant royalty revenue.
PDL BioPharma and the PDL BioPharma logo are considered trademarks of PDL BioPharma, Inc.
Forward-looking Statements
This press release contains “forward-looking statements” within the meaning of Section 27A of the Securities Act of 1933, as amended, and Section 21E of the Securities Exchange Act of 1934, as amended. Each of these forward-looking statements involves risks and uncertainties. Actual results may differ materially from those, express or implied, in these forward-looking statements. Important factors that could impair the value of the Company’s royalty assets, restrict or impede the ability of the Company to invest in new royalty bearing assets and limit the Company’s ability to pay dividends are disclosed in the risk factors contained in the Company’s Annual Report on Form 10-K, filed with the Securities and Exchange Commission. All forward-looking statements are expressly qualified in their entirety by such factors. We do not undertake any duty to update any forward-looking statement except as required by law.
TABLE 1
PDL BIOPHARMA, INC.
CONSOLIDATED STATEMENTS OF INCOME DATA
(In thousands, except per share amounts)
Three Months Ended | Twelve Months Ended | |||||||||||||||
December 31, | December 31, | |||||||||||||||
2016 | 2015 | 2016 | 2015 | |||||||||||||
Revenues | ||||||||||||||||
Royalties from Queen et al. patents | $ | 15,513 | $ | 121,240 | $ | 166,158 | $ | 485,156 | ||||||||
Royalty rights - change in fair value | 28,068 | 49,069 | 16,196 | 68,367 | ||||||||||||
Interest revenue | 5,503 | 7,606 | 30,404 | 36,202 | ||||||||||||
Product revenue, net | 17,541 | — | 31,669 | — | ||||||||||||
License and other | (133 | ) | 143 | (126 | ) | 723 | ||||||||||
Total revenues | 66,492 | 178,058 | 244,301 | 590,448 | ||||||||||||
Operating Expenses | ||||||||||||||||
Cost of product revenue (excluding amortization of intangible assets) | 4,065 | — | 4,065 | — | ||||||||||||
Amortization of intangible assets | 6,014 | — | 12,028 | — | ||||||||||||
General and administrative expenses | 12,597 | 12,545 | 39,790 | 36,090 | ||||||||||||
Sales and marketing | 527 | — | 538 | — | ||||||||||||
Research and development | 1,887 | — | 3,820 | — | ||||||||||||
Change in fair value of anniversary payment and contingent consideration | (5,799 | ) | — | (3,716 | ) | — | ||||||||||
Asset impairment loss | 3,735 | — | 3,735 | — | ||||||||||||
Acquisition-related costs | 59 | — | 3,564 | — | ||||||||||||
Loss on extinguishment of notes receivable | 51,075 | 3,979 | 51,075 | 3,979 | ||||||||||||
Total operating expenses | 74,160 | 16,524 | 114,899 | 40,069 | ||||||||||||
Operating income/(loss) | (7,668 | ) | 161,534 | 129,402 | 550,379 | |||||||||||
Non-operating expense, net | ||||||||||||||||
Interest and other income, net | 184 | 74 | 588 | 368 | ||||||||||||
Interest expense | (4,743 | ) | (5,349 | ) | (18,267 | ) | (27,059 | ) | ||||||||
Gain (loss) on extinguishment of debt | (2,353 | ) | 6,450 | (2,353 | ) | 6,450 | ||||||||||
Total non-operating expense, net | (6,912 | ) | 1,175 | (20,032 | ) | (20,241 | ) | |||||||||
Income/(loss) before income taxes | (14,580 | ) | 162,709 | 109,370 | 530,138 | |||||||||||
Income tax expense | (4,300 | ) | 62,135 | 45,711 | 197,343 | |||||||||||
Net income/(loss) | (10,280 | ) | 100,574 | 63,659 | 332,795 | |||||||||||
Less: Net income attributable to noncontrolling interests | 56 | — | 53 | — | ||||||||||||
Net income/(loss) attributable to PDL’s shareholders | $ | (10,336 | ) | $ | 100,574 | $ | 63,606 | $ | 332,795 | |||||||
Net income/(loss) per share | ||||||||||||||||
Basic | $ | (0.06 | ) | $ | 0.61 | $ | 0.39 | $ | 2.04 | |||||||
Diluted | $ | (0.06 | ) | $ | 0.61 | $ | 0.39 | $ | 2.03 | |||||||
Shares used to compute income per basic share | 163,975 | 163,601 | 163,805 | 163,386 | ||||||||||||
Shares used to compute income per diluted share | 164,549 | 163,801 | 164,192 | 163,554 | ||||||||||||
Cash dividends declared per common share | $ | — | $ | — | $ | 0.10 | $ | 0.60 | ||||||||
TABLE 2
PDL BIOPHARMA, INC.
CONDENSED CONSOLIDATED BALANCE SHEET DATA
(Unaudited)
(In thousands)
December 31, | December 31, | |||||||
2016 | 2015 | |||||||
Cash, cash equivalents and investments (includes restricted cash) | $ | 242,141 | $ | 220,352 | ||||
Total notes receivable | $ | 270,950 | $ | 364,905 | ||||
Total royalty rights - at fair value | $ | 402,318 | $ | 399,204 | ||||
Total assets | $ | 1,215,387 | $ | 1,012,205 | ||||
Total term loan payable | $ | — | $ | 24,966 | ||||
Total convertible notes payable | $ | 232,443 | $ | 228,862 | ||||
Total PDL’s stockholders’ equity | $ | 755,423 | $ | 695,952 | ||||
TABLE 3
PDL BIOPHARMA, INC.
CONDENSED CONSOLIDATED STATEMENT OF CASH FLOW DATA
(Unaudited)
(In thousands)
Twelve Months Ended | ||||||||
December 31, | ||||||||
2016 | 2015 | |||||||
Net income | $ | 63,659 | $ | 332,795 | ||||
Adjustments to reconcile net income to net cash provided by (used in) operating activities | 52,738 | (40,521 | ) | |||||
Changes in assets and liabilities | (14,679 | ) | 9,191 | |||||
Net cash provided by operating activities | $ | 101,718 | $ | 301,465 | ||||
TABLE 4
PDL BIOPHARMA, INC.
GAAP to NON-GAAP RECONCILIATION:
NET INCOME AND DILUTED EARNINGS PER SHARE
(Unaudited)
(In thousands, except per share amount)
A reconciliation between net income on a GAAP basis and on a non-GAAP basis is as follows: | ||||||||||||||||
Three Months Ended | Twelve Months Ended | |||||||||||||||
December 31, | December 31, | |||||||||||||||
2016 | 2015 | 2016 | 2015 | |||||||||||||
GAAP net income/(loss) attributed to PDL’s shareholders as reported | $ | (10,336 | ) | $ | 100,574 | $ | 63,606 | $ | 332,795 | |||||||
Adjustments to Non-GAAP net income/(loss) (as detailed below) | 1,716 | (7,561 | ) | 44,518 | (10,201 | ) | ||||||||||
Non-GAAP net income/(loss) attributed to PDL’s shareholders | $ | (8,620 | ) | $ | 93,013 | $ | 108,124 | $ | 322,594 | |||||||
An itemized reconciliation between net income/(loss) on a GAAP basis and on a non-GAAP basis is as follows: | ||||||||||||||||
Three Months Ended | Twelve Months Ended | |||||||||||||||
December 31, | December 31, | |||||||||||||||
2016 | 2015 | 2016 | 2015 | |||||||||||||
GAAP net income/(loss) attributed to PDL’s shareholders as reported | $ | (10,336 | ) | $ | 100,574 | $ | 63,606 | $ | 332,795 | |||||||
Adjustments: | ||||||||||||||||
Mark-to-market adjustment to fair value assets | (2,726 | ) | (14,632 | ) | 56,386 | (24,960 | ) | |||||||||
Non-cash interest revenues | (121 | ) | (533 | ) | (2,864 | ) | (5,307 | ) | ||||||||
Non-cash stock-based compensation expense | 1,093 | 697 | 3,742 | 2,045 | ||||||||||||
Non-cash debt offering costs | 3,942 | 3,219 | 10,009 | 12,963 | ||||||||||||
Mark-to-market adjustment on warrants held | 31 | (985 | ) | 906 | (985 | ) | ||||||||||
Amortization of the intangible assets | 6,014 | — | 12,028 | — | ||||||||||||
Mark-to-market adjustment of anniversary payment and contingent consideration | (5,799 | ) | — | (3,716 | ) | — | ||||||||||
Income tax effect related to above items | (718 | ) | 4,673 | (31,973 | ) | 6,043 | ||||||||||
Total adjustments | 1,716 | (7,561 | ) | 44,518 | (10,201 | ) | ||||||||||
Non-GAAP net income/(loss) | $ | (8,620 | ) | $ | 93,013 | $ | 108,124 | $ | 322,594 | |||||||
Use of Non-GAAP Financial Measures
We supplement our consolidated financial statements presented on a GAAP basis by providing additional measures which may be considered “non-GAAP” financial measures under applicable SEC rules. We believe that the disclosure of these non-GAAP financial measures provides our investors with additional information that reflects the amounts and financial basis upon which our management assesses and operates our business. These non-GAAP financial measures are not in accordance with generally accepted accounting principles and should not be viewed in isolation or as a substitute for reported, or GAAP, net income, and diluted earnings per share, and are not a substitute for, or superior to, measures of financial performance performed in conformity with GAAP.
“Non-GAAP net income“ is not based on any standardized methodology prescribed by GAAP and represent GAAP net income adjusted to exclude (1) mark-to market adjustments related to the fair value election for our investments in royalty rights presented in our earnings, which include the fair value re-measurement of future discounted cash flows for each of the royalty rights assets we have acquired, (2) non-cash interest revenue from notes receivable (3) stock-based compensation expense, (4) non-cash interest expense related to PDL debt offering costs, (5) mark-to market adjustments related to warrants held, (6) mark-
to-market adjustment related to acquisition-related contingent considerations, (7) amortization of intangible assets, and to adjust (7) the related tax effect of all reconciling items within our reconciliation of our GAAP to Non-GAAP net income. Non-GAAP financial measures used by PDL may be calculated differently from, and therefore may not be comparable to, non-GAAP measures used by other companies.
Exhibit 99.2


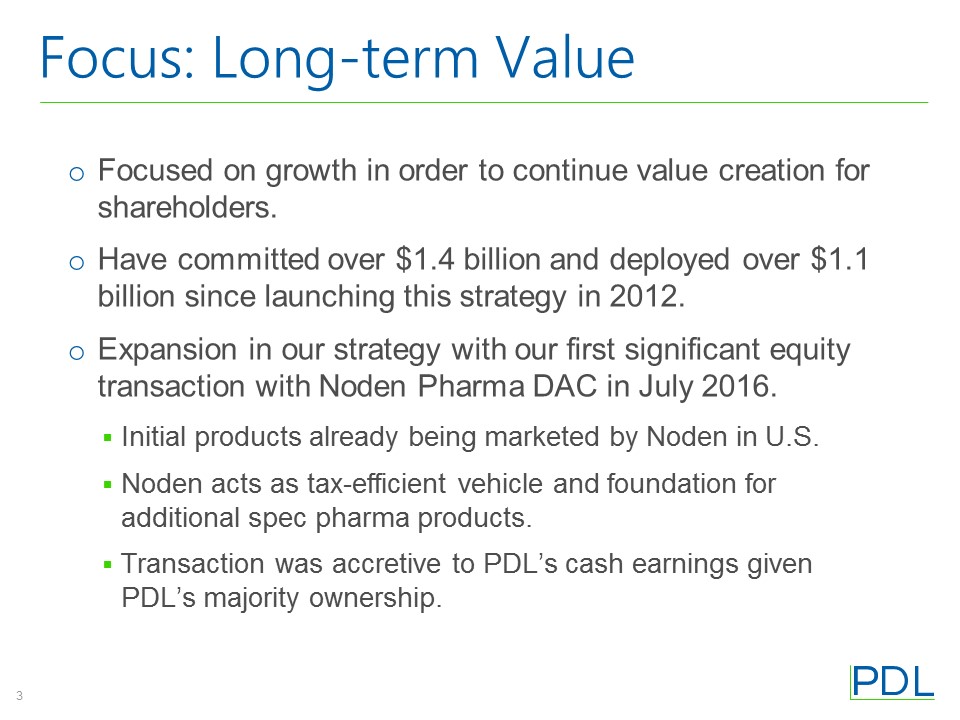


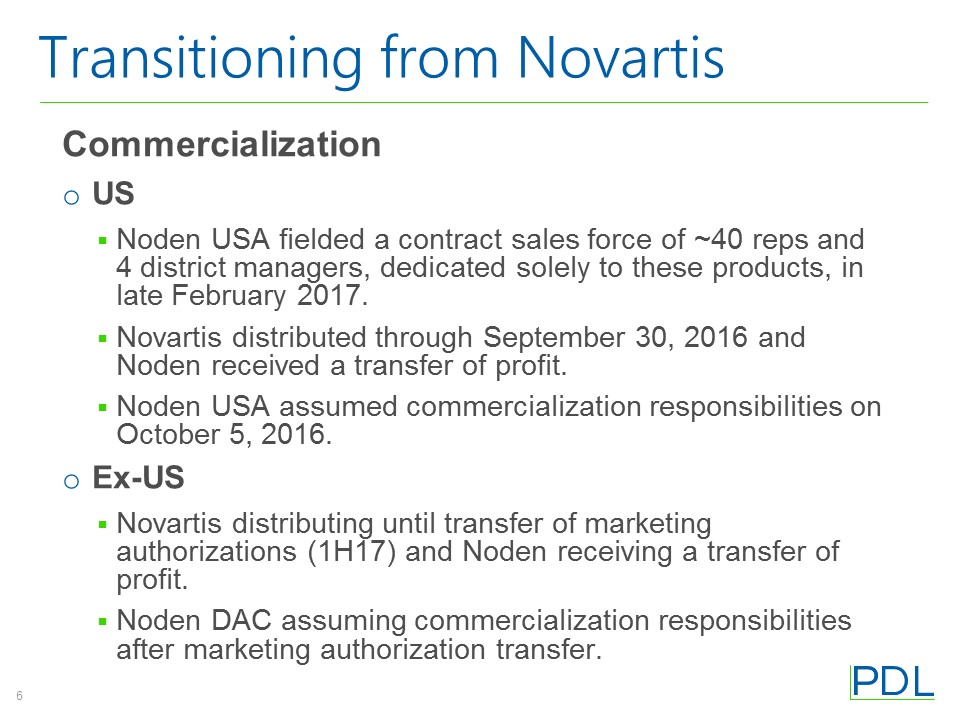


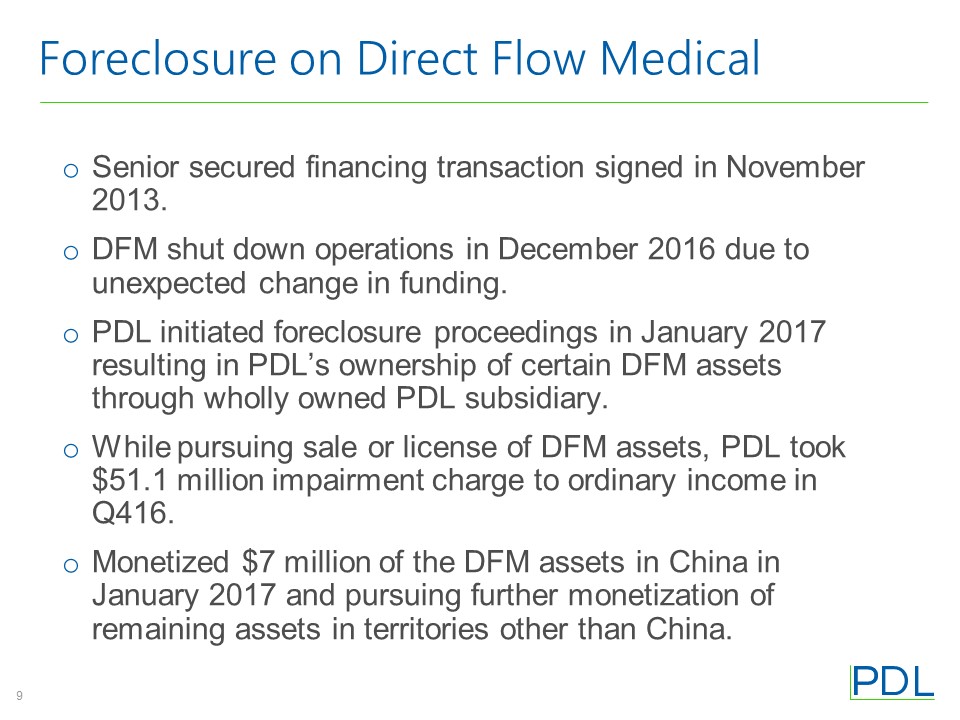


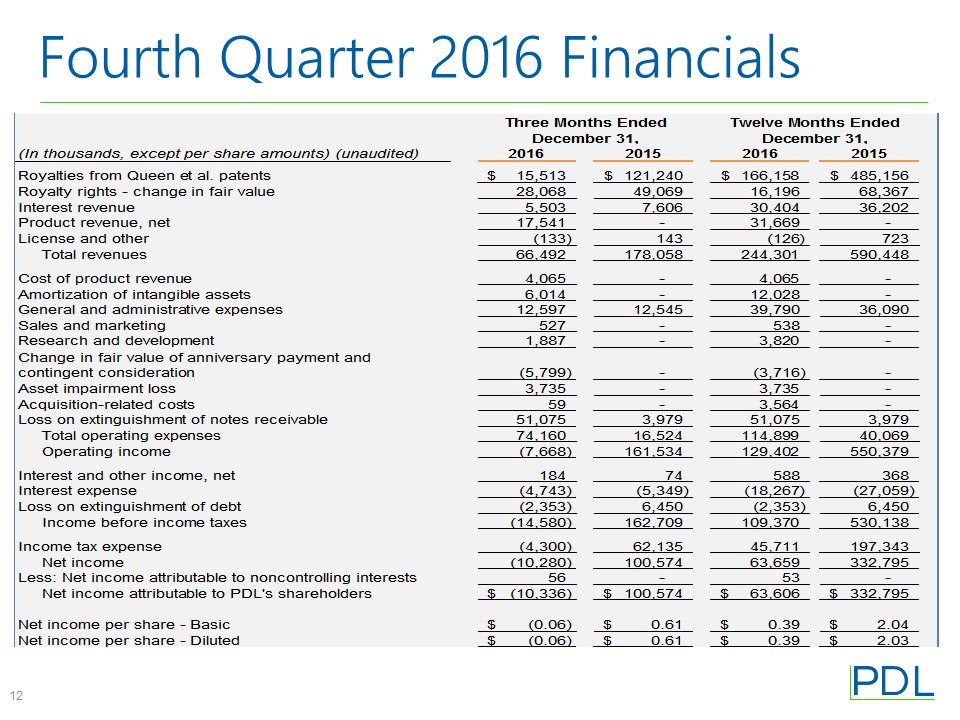

Exhibit 99.3
PDL BioPharma, Inc.
Q4 / Full Year 2016
March 1, 2017
Following are some of the key points regarding PDL’s fourth quarter and year-end 2016 financial and business results.
Highlighted Financial Results from Q4 and FY 2016
• | Total revenues of $66.5 million and $244.3 million for the three and 12 months ended December 31, 2016, respectively. |
• | GAAP diluted EPS of ($0.06) and $0.39 for the three and 12 months ended December 31, 2016, respectively. |
• | GAAP net loss attributable to PDL's shareholders of $10.3 million and net income of $63.6 million for the three and 12 months ended December 31, 2016, respectively. |
• | Non-GAAP net loss attributable to PDL's shareholders of $8.6 million and net income of $108.1 million for the three and 12 months ended December 31, 2016, respectively. |
The loss attributable to the three months ended December 31, 2016 was a result of a $51.1 million impairment charge relating to our Direct Flow Medical note receivable investment.
Updates on royalty-bearing products relating to Queen et al. Patents
Tysabri® (Approved royalty-bearing product relating to Queen et al. patents)
• | Continue to receive royalties on Tysabri from Biogen with respect to sales of the licensed product manufactured prior to patent expiry in jurisdictions providing patent protection licenses. |
• | PDL received a royalty payment for the first quarter of 2017 in the amount of $14.2 million for royalties earned on sales of Tysabri. The duration of this royalty payment is based on the sales of product manufactured prior to patent expiry, the amount of which is uncertain. |
• | Historical royalty and sales data are listed [in the table below.] |
Noden Pharma
• | On July 1, 2016, Noden Pharma DAC, a newly-formed company organized under the laws of Ireland purchased from Novartis the exclusive worldwide rights to manufacture, market, and sell the branded prescription medicine product sold under the name Tekturna® and Tekturna HCT® in the United States and Rasilez® and Rasilez HCT® in the rest of the world, and is indicated for the treatment of hypertension. |
• | PDL is a majority owner of Noden and holds three of five board seats. Noden has filled critical leadership positions over the past six months, and the companies are evaluating additional specialty pharma products in the form of optimized, established medicines, to acquire for Noden. |
• | Responsibilities related to Tekturna are actively transitioning from Novartis to Noden. As it relates to commercialization of Tekturna, Noden assumed commercialization responsibilities for the US in early October and has hired a dedicated contract sales force of approximately 40 reps and four district managers that began commercialization efforts at the end of February 2017. Initially, the deal called for Novartis to continue to distribute the four products on behalf of Noden worldwide, and Noden would receive a profit split on such sales. In the United States, the duration of the profit split ran from July 1, 2016 through October 4, 2016. |
• | Ex-US, Novartis companies will continue to distribute the products through transfer of the marketing authorizations in such countries (expected to occur in the first half of 2017) and Noden Pharma DAC will receive the profit transfer from Novartis. Novartis and Noden Pharma DAC are working to transfer the marketing authorizations from Novartis companies to Noden Pharma DAC. The primary focus of Noden Pharma DAC’s commercialization efforts will be EU, Switzerland and Canada. Noden Pharma DAC will likely seek distributors for certain territories, such as Japan. |
Page 1
PDL BioPharma, Inc.
Q4 / Full Year 2016
March 1, 2017
Updates on Income Generating Assets
Royalty Rights Assets
The following table provides additional details with respect to the fair value of the PDL royalty rights assets as of December 31, 2015 and with changes to December 31, 2016 as reflected in our Balance Sheet:
Fair Value as of | Royalty Rights - | Fair Value as of | |||||||||||||||||||
(in thousands) | December 31, 2015 | New Assets | Change in Fair Value | December 31, 2016 | |||||||||||||||||
Depomed | $ | 191,865 | $ | — | $ | (27,795 | ) | $ | 164,070 | ||||||||||||
VB | 17,133 | — | (2,136 | ) | 14,997 | ||||||||||||||||
U-M | 70,186 | — | (34,800 | ) | 35,386 | ||||||||||||||||
ARIAD | 50,041 | 50,000 | 8,590 | 108,631 | |||||||||||||||||
AcelRx | 67,437 | — | 46 | 67,483 | |||||||||||||||||
Avinger | 2,542 | — | (904 | ) | 1,638 | ||||||||||||||||
KYBELLA | — | 9,500 | 613 | 10,113 | |||||||||||||||||
$ | 399,204 | $ | 59,500 | $ | (56,386 | ) | $ | 402,318 | |||||||||||||
The following tables provides a summary of activity with respect to our royalty rights - change in fair value for the year ended December 31, 2016:
Change in | Royalty Rights - | |||||||||||||||||
Cash Royalties | Fair Value | Change in Fair Value | ||||||||||||||||
Depomed | $ | 59,342 | $ | (27,796 | ) | $ | 31,546 | |||||||||||
VB | 1,468 | (2,135 | ) | (667 | ) | |||||||||||||
U-M | 3,013 | (34,799 | ) | (31,786 | ) | |||||||||||||
ARIAD | 7,508 | 8,590 | 16,098 | |||||||||||||||
AcelRx | 8 | 46 | 54 | |||||||||||||||
Avinger | 1,220 | (905 | ) | 315 | ||||||||||||||
KYBELLA | 23 | 613 | 636 | |||||||||||||||
$ | 72,582 | $ | (56,386 | ) | $ | 16,196 | ||||||||||||
Updates on Royalty Rights Assets
Depomed, Inc.
• | Glumetza royalty audit is on-going. |
• | Monthly payments from Valeant continue to fluctuate from $2 million to $8 million. |
• | Recent product approvals, Jentadueto XR, Invokamet XR and Synjardy XR have yielded $17 million in milestones in 2016 and will begin generating royalties to PDL. |
• | Low to mid-single digit royalties to PDL on new product approvals expected to continue to 2023 for Invokamet XR and 2026 for Jentadueto XR and Synjardy XR. |
ARIAD Pharmaceuticals, Inc.
• | Ariad acquired by Takeda in February 2017. |
• | PDL has exercised its put option and will be repaid an estimated $110 million which is 1.2 times the $100 million advanced to Ariad less any sums already repaid. It is currently estimated that our annualized internal rate of return on this investment will be 18%. |
• | Repayment expected in late March or early April 2017. |
KYBELLA Royalty Agreement
• | On July 8, 2016, PDL entered into a royalty purchase agreement with an individual, whereby the Company acquired that individual's rights to receive certain royalties on sales of KYBELLA® by Allergan, in exchange for a |
Page 2
PDL BioPharma, Inc.
Q4 / Full Year 2016
March 1, 2017
$9.5 million cash payment and up to $1.0 million in future milestone payments based upon product sales targets. The first revenues on this transaction were recognized in Q3 2016. Royalties to be paid out every six months.
Notes Receivable
The following tables present the fair value of assets and liabilities not subject to fair value recognition by level within the valuation hierarchy:
December 31, 2016 | December 31, 2015 | |||||||||||||||||||||||||||
Carrying Value | Fair Value Level 2 | Fair Value Level 3 | Carrying Value | Fair Value Level 2 | Fair Value Level 3 | |||||||||||||||||||||||
(In thousands) | ||||||||||||||||||||||||||||
Assets: | ||||||||||||||||||||||||||||
Wellstat Diagnostics note receivable | $ | 50,191 | $ | — | $ | 52,260 | $ | 50,191 | $ | — | $ | 55,970 | ||||||||||||||||
Hyperion note receivable | 1,200 | — | 1,200 | 1,200 | — | 1,200 | ||||||||||||||||||||||
LENSAR note receivable | 43,909 | — | 43,900 | 42,271 | — | 42,618 | ||||||||||||||||||||||
Direct Flow Medical note receivable | 10,000 | — | 10,000 | 51,852 | — | 51,992 | ||||||||||||||||||||||
Paradigm Spine note receivable | — | — | — | 53,973 | — | 54,250 | ||||||||||||||||||||||
kaléo note receivable | 146,685 | — | 142,539 | 146,778 | — | 146,789 | ||||||||||||||||||||||
CareView note receivable | 18,965 | — | 19,200 | 18,640 | — | 19,495 | ||||||||||||||||||||||
Total | $ | 270,950 | $ | — | $ | 269,099 | $ | 364,905 | $ | — | $ | 372,314 | ||||||||||||||||
Updates on Notes Receivable
Wellstat Diagnostics, LLC
• | In NY court action commenced by PDL to collect from related entities who are guarantors of the loan, the judge ruled in favor of PDL and has appointed a magistrate to determine PDL’s damages. Wellstat appealed the ruling, and their appeal was heard in January 2017. |
• | In February 2017, the appellate division of the NY court reversed on procedural grounds the portion of the decision granting PDL summary judgment, but affirmed the portion of the decision denying the Wellstat Diagnostics guarantor defendants’ motion for summary judgment in which they sought a determination that the guarantees had been released. As a result, the litigation has been returned to the Supreme Court of New York to proceed on PDL’s claims as a plenary action. |
• | PDL has commenced a non-judicial foreclosure process to collect on the sale of certain Virginia real estate assets owned by the guarantors of the loan. |
Direct Flow Medical, Inc.
• | Potential lead investor unexpectedly withdrew its term sheet for tranched $65 million equity investment and certain ex-US rights to Direct Flow Medical (DFM) products. |
• | DFM shut down operations in December 2016. |
• | PDL initiated foreclosure proceedings in January 2017 which resulted in obtaining ownership of certain of the Direct Flow Medical assets through a wholly-owned subsidiary, DFM, LLC. |
• | PDL wrote off $51.1 million of assets against ordinary income in Q4 2016. |
• | In Q1 2017, PDL monetized $7.0million of those assets. PDL expects to further monetize assets, the amount of which, if any, is unknown. |
LENSAR Credit Agreement
• | Alphaeon is divesting all of its ophthalmology business, including LENSAR. |
• | In December 2016, LENSAR Inc. re-acquired the assets it had sold to Alphaeon and assumed the obligations under the PDL credit agreement. Also in December, LENSAR Inc., with the support of PDL, filed for bankruptcy under Chapter 11. LENSAR has filed a plan of reorganization with our support under which, subject to bankruptcy |
Page 3
PDL BioPharma, Inc.
Q4 / Full Year 2016
March 1, 2017
court approval, it is expected that LENSAR will issue equity securities to us in exchange for a portion of our claims in the Chapter 11 case and will become one of our operating subsidiaries. We estimate that this proceeding will be concluded in 2Q17.
• | In January 2017, the bankruptcy court approved a debtor-in-possession credit agreement whereby PDL agreed to provide up to approximately $2.8 million to LENSAR so that it can continue to operate its business during the remainder of the bankruptcy proceeding. |
Paradigm Spine Credit Agreement
• | On August 26, 2016, the Company received $57.5 million in connection with the prepayment of the loans under the Paradigm Spine Credit Agreement, which included a repayment of the full principal amount outstanding of $54.7 million, plus accrued interest and a prepayment fee. |
kaleo, Inc.
• | Despite Auvi-Q being voluntarily pulled from market and Sanofi returning the product right to kaléo, kaléo has made all required interest payments in full and on time to date. |
• | Evzio sales have been much stronger than projected so far. This is secondary source of repayment to PDL. |
• | kaléo has publicly announced that Auvi-Q has returned to the market in February 2017. |
Forward-looking Statements
This document contains "forward-looking statements" within the meaning of Section 27A of the Securities Act of 1933, as amended, and Section 21E of the Securities Exchange Act of 1934, as amended. Each of these forward-looking statements involves risks and uncertainties. Actual results may differ materially from those, express or implied, in these forward-looking statements. Important factors that could impair the value of the Company's royalty assets, restrict or impede the ability of the Company to invest in new income generating assets and limit the Company's ability to pay dividends are disclosed in the risk factors contained in the Company's Annual Report on Form 10-K, as updated by subsequent quarterly reports filed with the Securities and Exchange Commission, as updated by subsequent filings. All forward-looking statements are expressly qualified in their entirety by such factors. We do not undertake any duty to update any forward looking statement except as required by law.
Page 4
PDL BioPharma, Inc.
Q4 / Full Year 2016
March 1, 2017
Queen et al. Royalties | ||||||||||
Royalty Revenue by Product ($ in 000's) * | ||||||||||
Tysabri | Q1 | Q2 | Q3 | Q4 | Total | |||||
2017 | 14,156 | — | — | — | 14,156 | |||||
2016 | 13,970 | 14,232 | 14,958 | 15,513 | 58,673 | |||||
2015 | 14,385 | 13,614 | 13,557 | 14,031 | 55,587 | |||||
2014 | 12,857 | 13,350 | 16,048 | 15,015 | 57,270 | |||||
2013 | 12,965 | 13,616 | 11,622 | 12,100 | 50,304 | |||||
2012 | 11,233 | 12,202 | 11,749 | 12,255 | 47,439 | |||||
2011 | 9,891 | 10,796 | 11,588 | 11,450 | 43,725 | |||||
2010 | 8,791 | 8,788 | 8,735 | 9,440 | 35,754 | |||||
2009 | 6,656 | 7,050 | 7,642 | 8,564 | 29,912 | |||||
2008 | 3,883 | 5,042 | 5,949 | 6,992 | 21,866 | |||||
2007 | 839 | 1,611 | 2,084 | 2,836 | 7,370 | |||||
2006 | — | — | — | 237 | 237 | |||||
* As reported to PDL by its licensees. Totals may not sum due to rounding. | ||||||||||
Page 5
PDL BioPharma, Inc.
Q4 / Full Year 2016
March 1, 2017
Queen et al. Sales Revenue | ||||||||||
Reported Licensee Net Sales Revenue by Product ($ in 000's) * | ||||||||||
Tysabri | Q1 | Q2 | Q3 | Q4 | Total | |||||
2017 | 471,877 | — | — | — | 471,877 | |||||
2016 | 465,647 | 474,379 | 498,618 | 517,099 | 1,955,743 | |||||
2015 | 479,526 | 453,786 | 451,898 | 467,735 | 1,852,945 | |||||
2014 | 428,561 | 442,492 | 534,946 | 500,511 | 1,906,510 | |||||
2013 | 434,677 | 451,358 | 387,407 | 403,334 | 1,676,776 | |||||
2012 | 374,430 | 401,743 | 391,623 | 408,711 | 1,576,508 | |||||
2011 | 329,696 | 356,876 | 388,758 | 381,618 | 1,456,948 | |||||
2010 | 293,047 | 287,925 | 293,664 | 316,657 | 1,191,292 | |||||
2009 | 221,854 | 229,993 | 257,240 | 285,481 | 994,569 | |||||
2008 | 129,430 | 163,076 | 200,783 | 233,070 | 726,359 | |||||
2007 | 30,468 | 48,715 | 71,972 | 94,521 | 245,675 | |||||
2006 | — | — | — | 7,890 | 7,890 | |||||
* As reported to PDL by its licensee. Dates in above charts reflect when PDL receives | ||||||||||
royalties on sales. Sales occurred in the quarter prior to the dates in the above charts. | ||||||||||
Totals may not sum due to rounding. | ||||||||||
Page 6